For each participant, on the study result, a data chart is available.

To enter the Data chart, you can enter the "Quality Stats and Drop-rate", choose "Participant Quality Stats" and click "Data Chart" for the desired item.

This feature is explained in the video below:
This chart changes for different parameters of the fixation filters.

The horizontal axis represents time (in ms). You can adjust it to your needs (see the data only for some part of the data collected, i.e., between the 1st and the 5th second of the item display time) using the orange slider under the chart.
The vertical axis represents values:
- in percents for X and Y values,
- in percents of screen diagonals per second for the velocity.
Velocity changes when the X or Y values change.
So, as you can see, this isn't the (X,Y) chart, but (X,t), (Y,t) and (V,t), where:
- X - x position of the gaze on the screen,
- Y - y position of the gaze on the screen,
- V - gaze velocity,
- t - time.
For fixations, only the time of their duration is represented.
As default, denoised values are shown, but you can also see the raw data (values collected at the time of sampling).
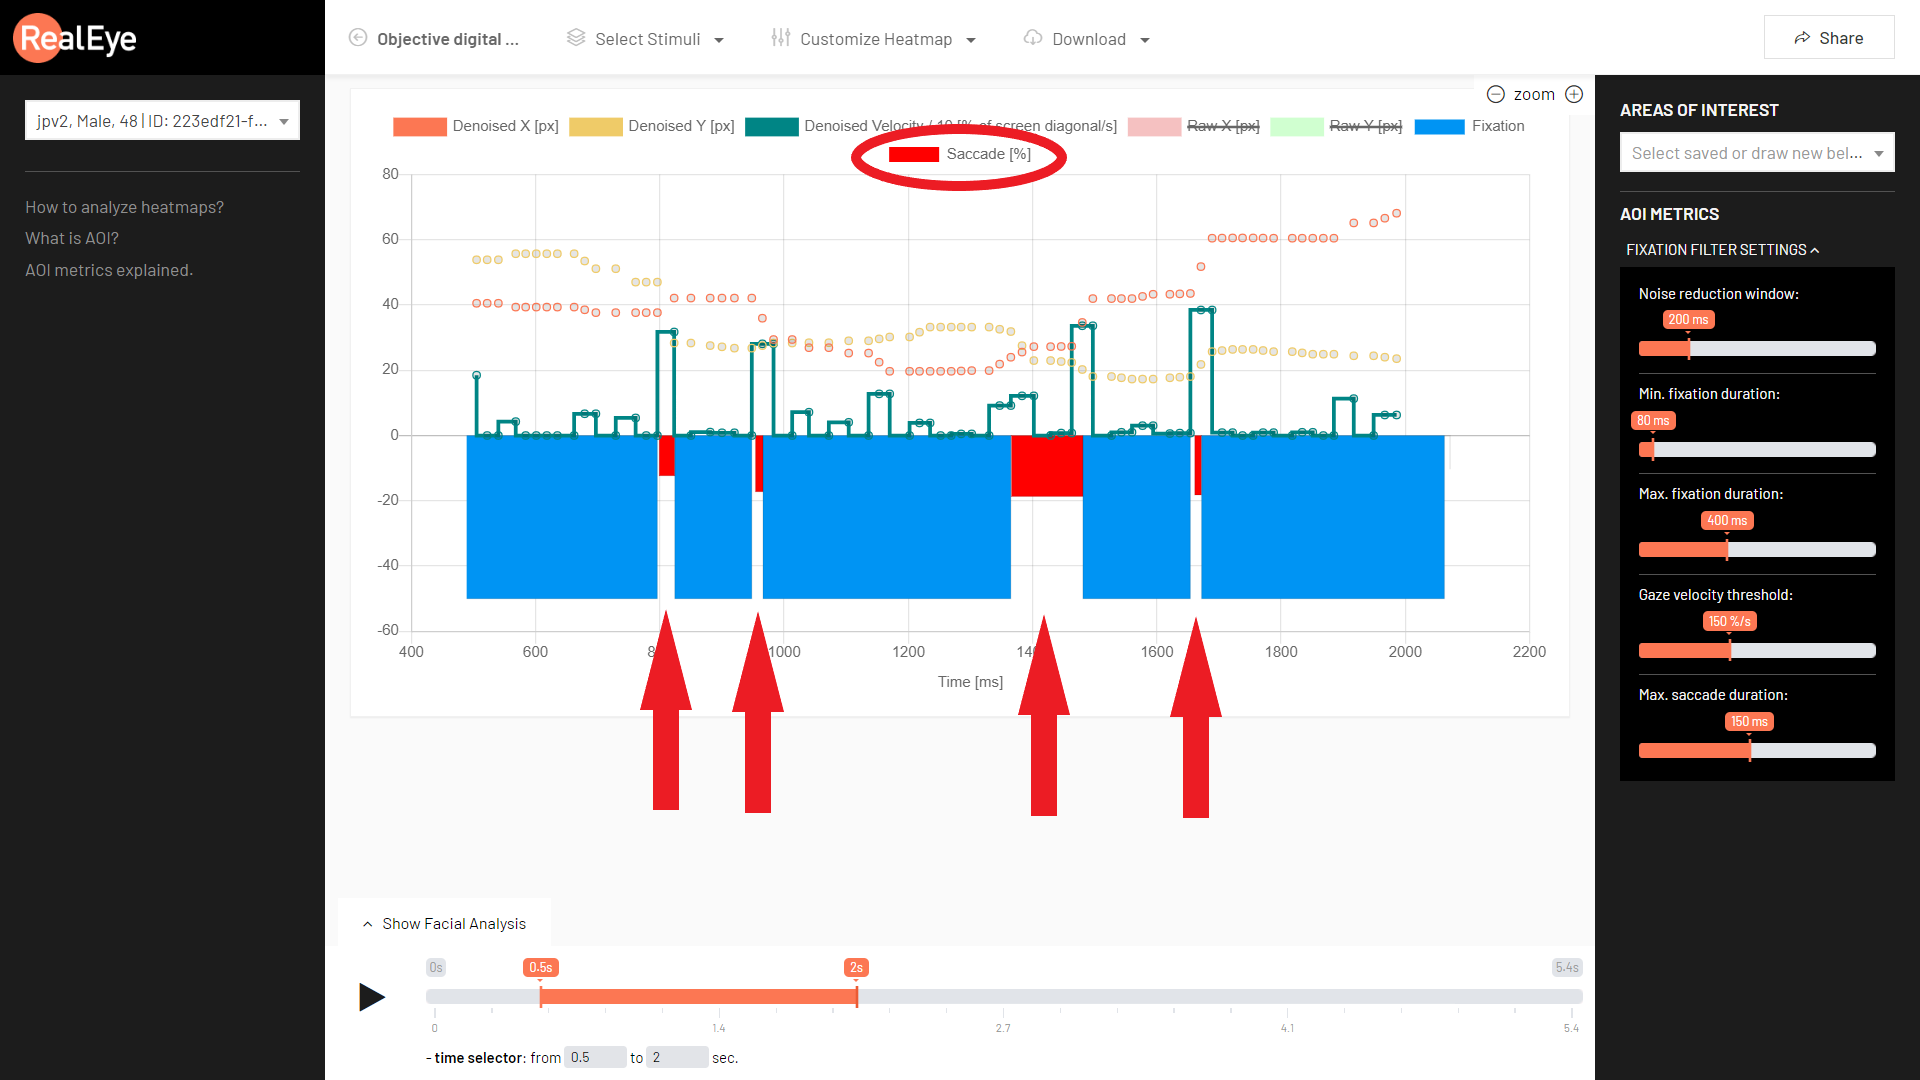
NOTE: from the RealEye v10.3, there are also saccades available on the data chart: